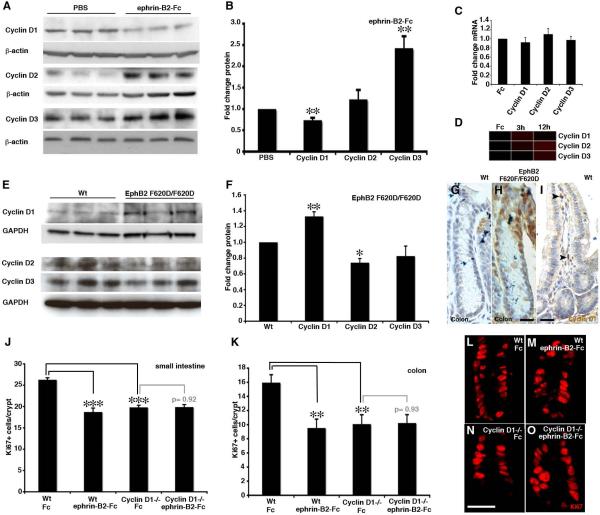
Figure 5. Cyclin D1 is required for the mitogenic effect of EphB.
(A and B) Western blot analysis of cyclin D levels in the colon after inhibition of EphB signaling with ephrin-B2-Fc compared to vehicle (PBS).
(C and D) mRNA levels for cyclin D family members are not altered after an injection of ephrin-B2-Fc as assayed by qRT-PCR (C, at 12 hours after ephrin-B2-Fc injection) or microarray analysis (D).
(E and F) Western blot analysis of cyclin D levels in the colon in wild type (Wt) mice and in mice with a modified (F620D/F620D) constitutively active EphB2 receptor.
(G and H) Cyclin D1 levels are too low to be detected by immunohistochemistry in wild type mice, but are readily detected in cell nuclei in colon crypts in EphB2 F620D/F620D mice. (I) Cyclin D1 positive cells are detected in the stroma of wild type small intestine (arrowheads).
(J and K) Quantification of Ki67-immunoreative cells in crypts of the small intestine and colon reveals a similar degree of reduction in the number of proliferating cells in cyclin D1 −/− mice and in animals receiving an ephrin-B2-Fc injection (24h prior to analysis) compared to wild type animals receiving control Fc protein. Administration of ephrin-B2-Fc does not reduce proliferation further in cyclin D1 −/− mice.
(L–O) Ki67-immiunoreactive cells in the crypts of the small intestine.
n=3 mice in each group, except for n=2 in some cyclin D1 −/− groups. Data are represented as mean+SEM. Scale bar=10 μm in G and 30μm in I. ** = p≤0.01, *** = p≤0.001, Student's t test.

