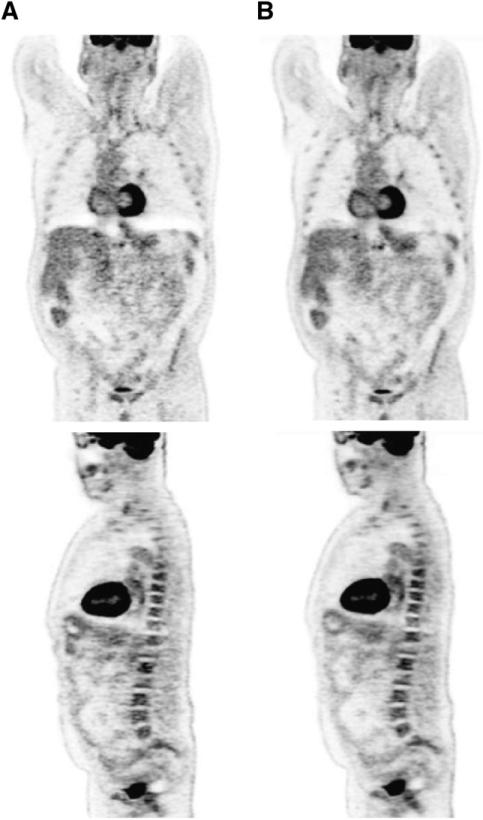
FIGURE 7.
Coronal (top) and sagittal (bottom) sections through 18F-FDG PET/CT scan of a patient with esophageal cancer. The 61-y-old male patient had a BMI of 27 and was injected with 366.3 MBq (9.9 mCi) of 18F-FDG. After 90-min uptake period, patient underwent CT scan (130 kV; 180 mAs), followed by PET scan that was acquired at = bed positions for 3 min per bed. PET data were reconstructed into 168 × 168 matrix by (A) baseline algorithm with PSF (4 iterations, 14 subsets, no smoothing), and (B) baseline algorithm with PSF and TOF (2 iterations, 14 subsets, no smoothing) and time resolution kernel of 590 ps.

