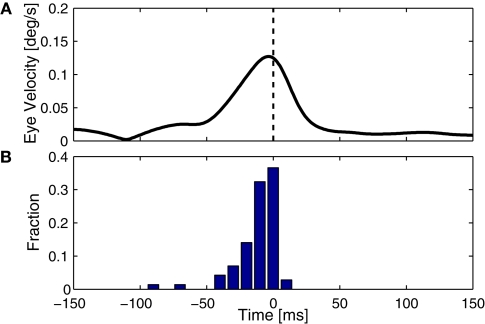
Figure 5.
Timing of cerebellar activity. (A) Shows a simple spike triggered average of eye velocity in response to white noise optokinetic stimulation. The white noise stimulus was provided by a panaromic projector system and consisted of a hexagonal matrix of green patches that were rotated coherently around the animal according to a three dimensional gaussian white noise process filtered through a 20-Hz low-pass filter. Note that the curve of this neuron peaks slightly before 0 ms, i.e. the P-cell is active slightly after the actual movement. (B) Summarizes the timing of the peak in 71 Purkinje cells, showing activity that more or less coincides with the movement (Winkelman and Frens, 2007).

