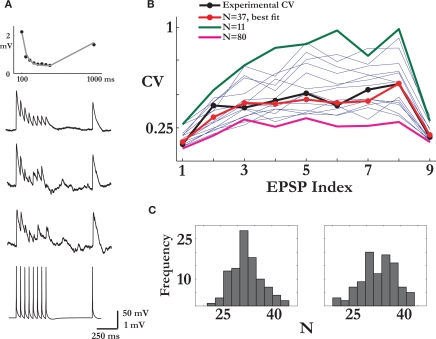
Figure 1.
Estimating the number of release sites N. (A) Bottom to top: the pre-synaptic spike train, two examples of noisy post-synaptic single traces and the average response for that synaptic connection. The top panel shows the fit of the deterministic model of short-term synaptic depression (gray line) to the set of average EPSPs amplitudes (in black). (B) Estimation of N: the CVs of the nine EPSPs of the synaptic connection in (A) (black trace) were compared to the CVs calculated from the Monte Carlo simulations, each with a different value of N (thin blue traces). In the simulations, the parameters that govern the release process, the probability of release and the recovery time constant, were those estimated from the connection's average response. Here, the simulation with N = 37 resulted in the best fit (red trace). The x-axis labelling represents the nine synaptic responses along the spike train (the first eight) and the recovery test [the ninth EPSP; see in (A)]. (C) The histograms of the estimated number of release sites from a 100 repetitions of the procedure presented in (B), for two recordings of the synaptic connection in (A) taken 10 min apart. The mean of the right and left distributions were 32.8 and 33.3.

