Figure 3.
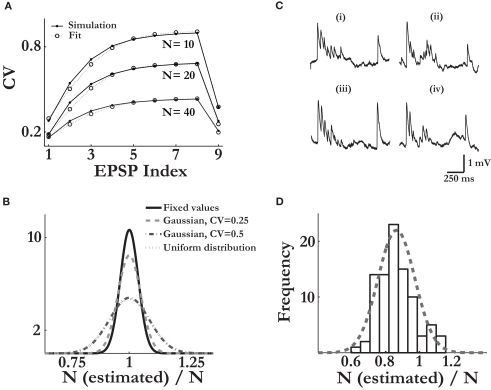
The estimation method is robust for various types of noise elements. Verifying the validity of the release-parameters uniformity assumption: (A) The analytically calculated CV values of the nine responses of three different virtual synapses, each with a different number of release sites (marked in figure) and with non-uniform sets of the release parameters (pi and τrec,i, i = 1…N; solid lines, Eq. 12); and the computed CV values of the corresponding three uniform synapses, in which the release parameters, U and τrec, were equal for all N release sites (dashed lines, Eq. 13). x-axis labelling represents the nine synaptic responses along the spike train. As in Figure 1B, the CV of the ninth EPSP is similar to that of the first EPSP, reflecting the recovery of the synaptic responses from depression (e.g. Figure 1A). The pi and τrec,i were drawn from a Gaussian distribution with the standard deviation half the value of the mean. (B) 500 virtual synapses were simulated for each of the distributions of the release parameters considered. With the calculated uniform release parameters for each synapse, U and τrec, Eq. 12 was fitted to Eq. 11 to produce an estimated value of N. The distributions of the ratio of the estimated value and the true value of N are shown for the cases in which pi and τrec,i were fixed for all release sites; were drawn from a narrow Gaussian distribution (standard deviation was 0.25 of the mean); a wide Gaussian distribution (standard deviation was 0.5 of the mean); and from a uniform distribution [with boundaries of (0.05 0.95) for pi, and 50 ms 1200 ms for τrec,i]. Simulations of realistic synaptic connections: (C) Examples of simulated single traces, in which various sources of synaptic variability were considered and background slice activity was added, (iii) and (iv) (see Materials and Methods); compared to single traces recorded in experiment, (i) and (ii). The values of the synaptic parameters in the simulated traces were similar to the values estimated for the measured synaptic connection. (D) Estimating the number of release sites from the simulations of the noisy synaptic connections reveals a slight bias toward lower values than the true number of release sites considered. The broken-line curve represents the best Gaussian fit with 0.88 ± 0.1 (mean ± std). In the simulations, the values of N were either 10, 20, 30, 40 or 80, and the release parameters were drawn from the wide Gaussian distribution (see B, Materials and Methods).

