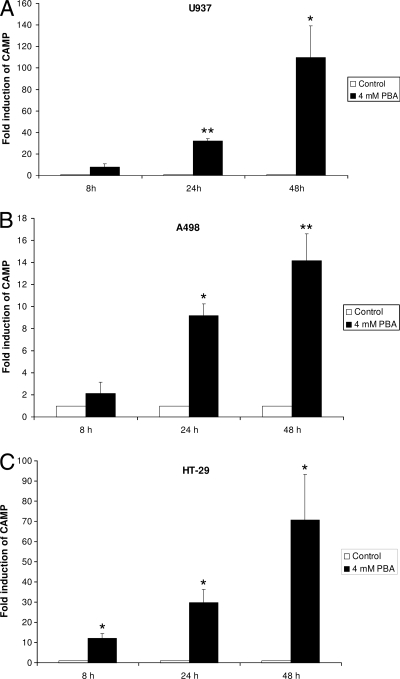
FIG. 2.
Induction of CAMP mRNA expression by PBA. U937 (A), A498 (B), and HT-29 (C) cells were stimulated with 4 mM PBA or solvent alone and harvested after the indicated period of time. CAMP mRNA levels were determined by real-time RT-PCR. Individual samples were normalized to total RNA input. Results were plotted as induction over control samples at the respective time points. Error bars indicate SEM from at least three independent experiments. *, P < 0.05; **, P < 0.01.

