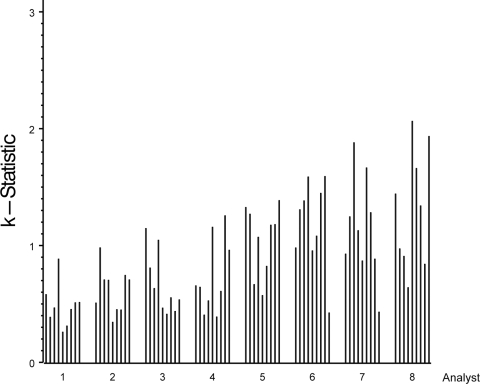
FIG. 1.
Plot of Mandel's k statistic by sample within analyst (1 to 8). Analyst order was determined by visual observation of least-variable analyst to most-variable analyst; sample order is the same as shown in Table 1 (samples with values of <15 EU/ml were excluded from this analysis). The height of the bar is proportional to the analyst's variability per sample.

