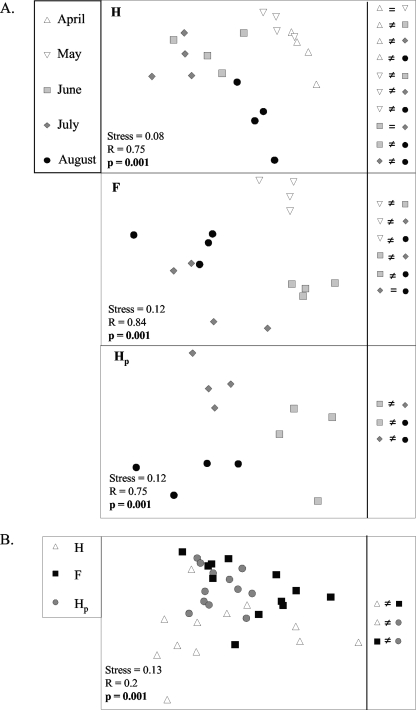
FIG. 1.
MDS representation of the structure of the nirK denitrifier community (assessed by DGGE analysis of nirK genes) on different sampling dates for three spatial locations, H, Hp, and F, in soil under potato cultivation (A) and at different row locations across the sampling dates (from June to August) (B). The similarities or differences in community structures are indicated. See Tables 1 and 2 for results of ANOSIM.

