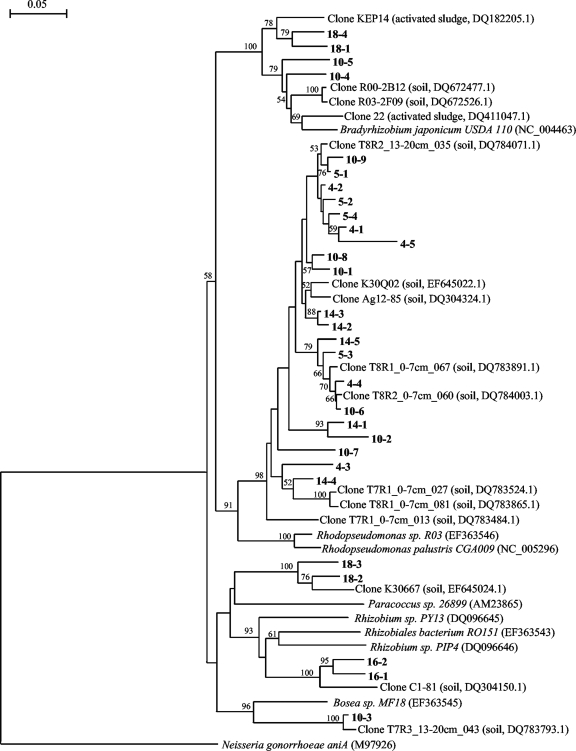
FIG. 6.
Neighbor-joining phylogenetic tree of partial nirK sequences of clones representative of some DGGE band positions in relation to nirK sequences of the closest uncultured and cultured relatives. Clone sequences from this study are labeled by numbers in bold. The first number corresponds to the band position, and the second number corresponds to clones with an identical DGGE band position but different sequences. The sources and accession numbers of the sequences are indicated in brackets. The scale bar indicates 5% nucleotide substitutions. Bootstrap values greater than 50% (500 replicates) are reported at the nodes. The sequence of aniA from Neisseria gonorrhoea served as an outgroup to root the phylogram.

