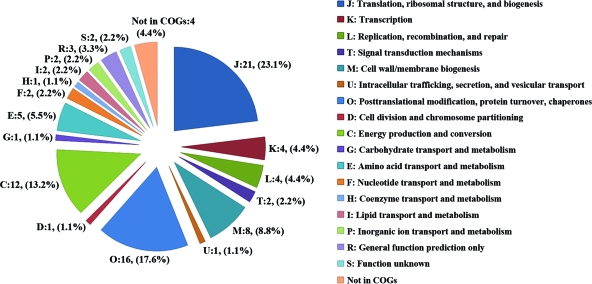
FIG. 2.
Functional distribution of identified R. parkeri proteins. The pie chart displays the proportion of identified proteins assigned to different functional categories according to the COGs functional classification (http://www.ncbi.nlm.nih.gov/COG). The number and percentage of identified proteins associated with each COG functional category are shown.

