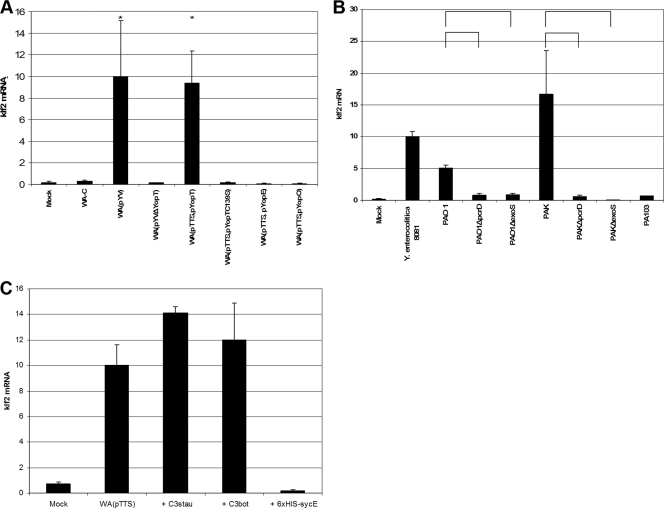
FIG. 2.
Identification of bacterial klf2-inducing proteins. (A) klf2 mRNA expression in J774A.1 cells after infection with different Y. enterocolitica mutant strains (detailed in Table 2). The graphical display is as described in the legend to Fig. 1. *, statistically significant (t test; P ≤ 0.05) induction of klf2 mRNA compared to infection with strain WA-C. (B) klf2 mRNA levels in J774A.1 cells after infection with different P. aeruginosa wild-type and mutant strains (see Table 2). The graphical display is as described in the legend to Fig. 1. Horizontal brackets indicate statistically significant (t test; P ≤ 0.05) differences in klf2 mRNA expression levels. (C) klf2 induction by recombinant EDIN-B or C. botulinum C3 toxin in J774A.1 cells. The graphical display is as described in the legend to Fig. 1. sycE, irrelevant protein used as negative control.

