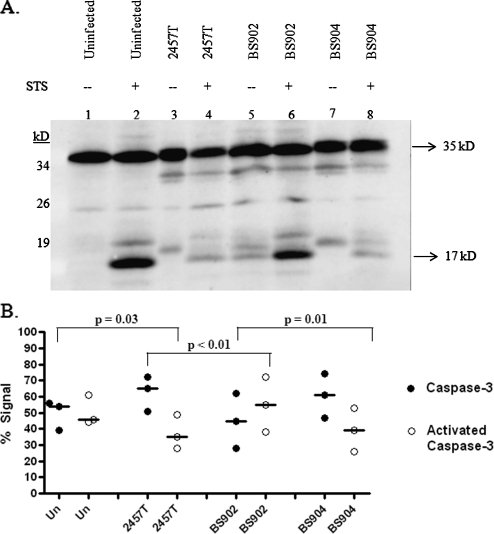
FIG. 3.
Western blot analysis for caspase-3 activation. (A) Whole-cell lysates were separated by SDS-polyacrylamide gel electrophoresis and analyzed by immunoblotting with antibodies that recognize the full-length, inactive form of caspase-3 (35 kDa) and the 17-kDa fragment resulting from cleavage during activation. There are some extra bands at ∼33 and 18 kDa in lanes containing bacterial strains. These bands are Shigella proteins that cross-react with the anti-caspase-3 antibodies in the Western blot. Adsorption of the antibody significantly reduced the intensity of the bands, but was not able to remove them completely (data not shown). Equal loading was verified by Coomassie staining for total protein (data not shown). (B) Densitometry analysis of the caspase-3 Western blot, with the percent total caspase-3 signal represented on the y axis. The graph is the scatter plot of the amount of inactive caspase at 35 kDa (closed circles) compared to the amount of activated caspase-3 (open circles) at 17 kDa for each treatment of three repeated experiments. A horizontal line represents the median value for each protein in each treatment. P values were determined using Tukey's ANOVA post hoc test with normalization of the data to the mean of the gels. “Un” represents uninfected HeLa cells, while infected monolayers are represented by the strain number used in the treatment groups. All groups were treated with STS.

