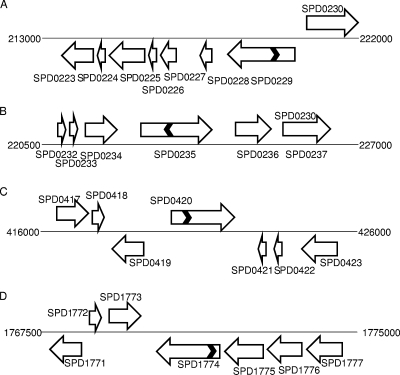
FIG. 2.
Schematic representation of genomic regions containing putative pfl genes (SPD0235 and SPD0420) (B and C) and pflA genes (SPD0229 and SPD1774) (A and D). The chromosome is represented with a thin solid line, and genes are shown with a block arrow. The chevrons in SPD0229, SPD0235, SPD0420, and SPD01774 represent the approximate positions of insertion (see the text for details), and the direction of chevrons represents the orientation of the spectinomycin cassette. The diagram is not drawn to scale.

