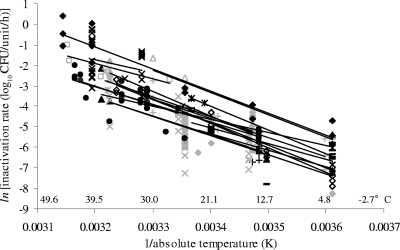
FIG. 2.
Effect of temperature on rate of inactivation of E. coli for 19 individual studies with rate data for three or more temperatures in the range of 0 to 47°C. The data are shown as Arrhenius plots [ln(inactivation rate) versus 1/absolute temperature]. The lines shown are simple linear regressions fitted to the data for each individual study. Equivalent Celsius temperatures are shown for convenience.

