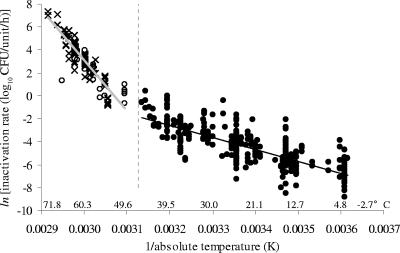
FIG. 3.
Changing effect of temperature on rate of inactivation of E. coli for temperatures above and below 47°C (shown by the dashed line), which is the maximum temperature for growth of most E. coli strains. The data are shown as an Arrhenius plot [ln(inactivation rate) versus 1/absolute temperature]. Inactivation rate data for temperatures above 47°C include data derived from fermented meats and analogous broth systems (○), previously shown in Fig. 1, and from fresh meat (×). Inactivation rate data for temperatures of 0 to 47°C are from fermented meats and analogous aqueous systems (•) and are also shown in Fig. 1. A simple linear regression line fitted to the data for temperatures above 47°C is given by the gray line (y = −43,665x + 134.11; R2 = 0.8110), and that for 0 to 47°C is given by the black line (y = −10,483x + 30.974; R2 = 0.607). Equivalent Celsius temperatures are shown for convenience.

