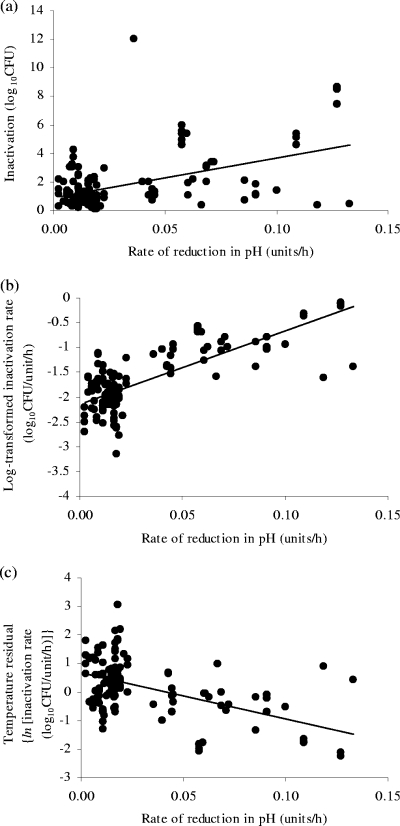
FIG. 4.
Effect of rate of reduction in pH during fermentation on total amount (a) and rate of inactivation (b) of E. coli and on inactivation rate normalized for temperature in the range of 0 to 47°C (c), using equation 2, to assess the cryptic effect of temperature in this analysis. Simple linear regression fitted to the data is given by the lines, which fit the equations y = 27.8847x + 0.8466 (R2 = 0.234), y = 14.7078x − 2.1350 (R2 = 0.585), and y = −16.2437x − 1.0065 (R2 = 0.266), respectively.

