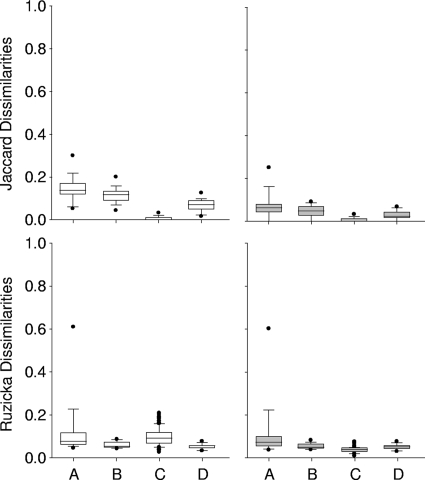
FIG. 1.
Whisker plots showing the Ruzicka and Jaccard dissimilarities computed for three steps of the T-RFLP analysis. Shown are dissimilarity values obtained when we tested the impacts of PCR amplification (A), enzymatic restriction (B), the electrophoresis conditions and fragment size (intercapillary variability) (C), and the run-to-run variability using 15 different samples in three successive runs (D). White bars, raw data sets; gray bars, data sets without inconsistent small-area T-RFs (<300 RFU in peak area); •, outliers.

