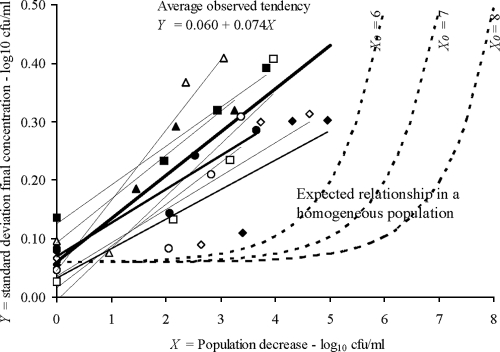
FIG. 3.
Relationship between the standard deviation of the log of the final bacterial concentration and the decrease in the log of the bacterial concentration after several heat treatments. The symbols are the same as those used in Fig. 2. The continuous lines show the relationships found in our experiments, while the dashed lines show the expected relationships for the log10 of the initial bacterial concentrations (X0) used in our experiments when the inactivation times for the cells within a population are assumed to be identically distributed and independent of one another.

