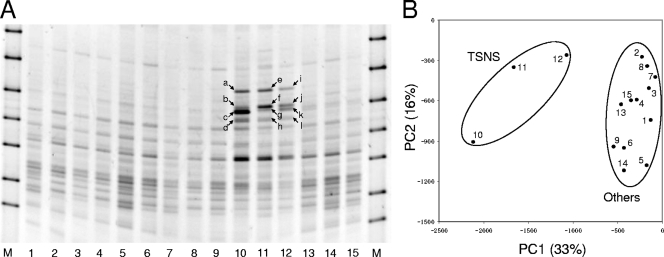
FIG. 1.
Community structures assessed by DGGE analysis. (A) DGGE banding profiles of the five samples (three replicates each). Twelve bands (bands a to l, indicated by arrows) were unique to the TSNS samples and were excised from lanes 10 to 12 and used for sequence analysis. Lanes M, DGGE marker II (Nippon Gene, Tokyo, Japan); lanes 1 to 3, unincubated control (TSBA sample); lanes 4 to 6, soil samples incubated without substrates (TSCO sample); lanes 7 to 9, soil samples incubated with nitrate (TSNI sample); lanes 10 to 12, soil samples incubated with nitrate and succinate (TSNS sample); lanes 13 to 15, soil samples incubated with succinate (TSSU sample). (B) PCA plot based on the DGGE profile. The normalized location and intensity of each DGGE band were used in the PCA. The numbers in the plot correspond to the lanes in panel A. The percentages in parentheses are the percentages of variation explained by the components.

