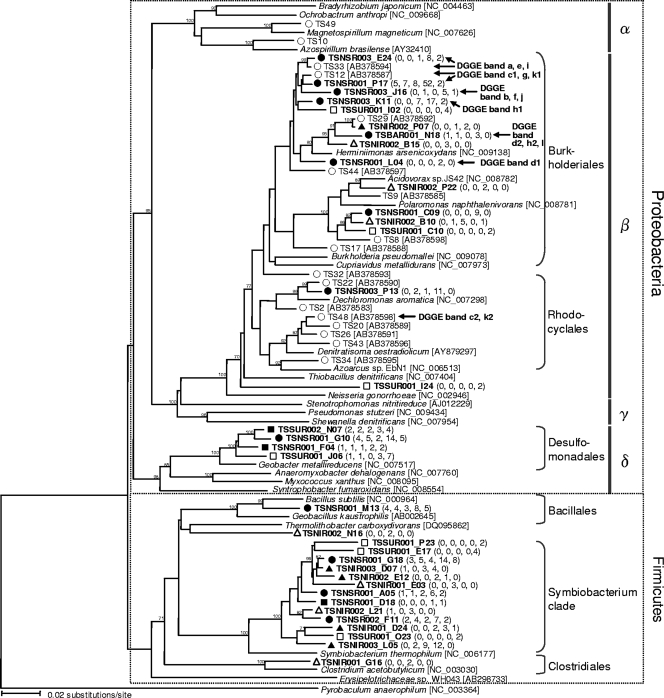
FIG. 5.
Neighbor-joining tree showing phylogenetic relationships between specifically enriched OTU0.03s (in bold type) and the OTU0.03s previously reported in a SIP study (37). Bootstrap values (expressed as percentages) were generated using 1,000 replicates, and only values greater than 70% are shown. The numbers in parentheses are the numbers of clones in the OTU0.03. The OTU0.03s showing the greatest similarity to the DNA sequences retrieved from DGGE analysis (Fig. 1A) are indicated by arrows. Legend: ▵, specifically enriched OTU0.03s in the TSNI sample; ▴, commonly enriched OTU0.03s in the TSNI and TSNS samples; •, specifically enriched OTU0.03s in the TSNS sample; ▪, commonly enriched OTU0.03s in the TSNS and TSSU samples; □, specifically enriched OTU0.03s in the TSSU sample; ○, clones obtained from the previous SIP study (37). α, Alphaproteobacteria; β, Betaproteobacteria; γ, Gammaproteobacteria; δ, Deltaproteobacteria.

