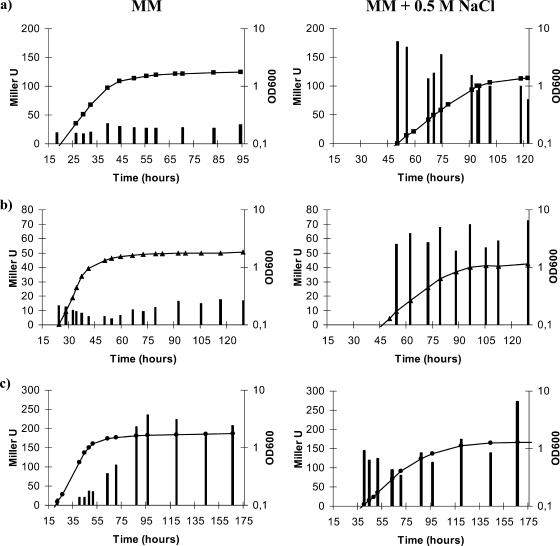
FIG. 5.
Expression of the transcriptional fusions otsA::uidA (a), treY::uidA (b), and treS::uidA (c) during growth in MM (left) or MM plus 0.5 M NaCl (right). The data shown are representative of two independent experiments. OD600, optical density at 600 nm; Miller U, β-glucuronidase activity expressed as Miller units.

