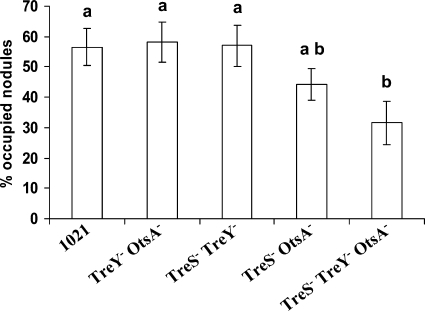
FIG. 8.
Nodule competition assays. The data shown represent the percentages of nodules occupied by the indicated strain after coinoculation (ratio 1:1) with strain 1021 (pGUS3). Bars correspond to standard errors, and different letters indicate significant differences according to an ANOVA test (P < 0.05). The data shown are representative of two independent experiments.

