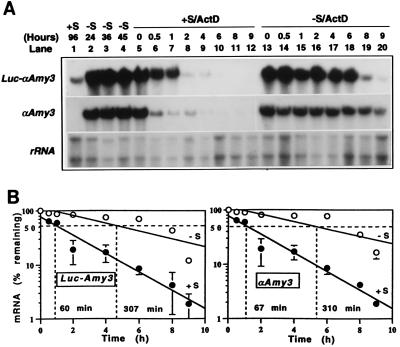
Figure 3.
The αAmy3 3′ UTR functions as a sugar-dependent mRNA stability determinant. (A) Transformed cell line LAm-3 was suspension cultured in sucrose-containing (+S) medium for 96 h (RNA in lane 1) and transferred to sucrose-free (−S) medium for 24 h (RNA in lane 2). ActD was added to the medium to a final concentration of 10 μg/ml. Cells were incubated in the −S medium containing ActD for another 12 h and then divided in half. Half the cells were transferred to a +S medium containing ActD (RNAs in lanes 5–12). The other half were transferred to a −S medium containing ActD (RNAs in lanes 13–20). Cells were collected after 0.5–9 h, and RNAs were purified. RNA gel blot analysis was performed by using various probes used in the experiment described in Fig. 2. The Luc and αAmy3 probes hybridized to the same blot, and the rRNA probe hybridized to another parallel-prepared blot. Five micrograms of total RNA was loaded in each lane. Lanes 3 and 4, cells incubated in −S medium lacking ActD for 36 and 45 h, respectively. (B) Levels of mRNA shown in lanes 5–20 of A were quantified by using the PhosphorImager. Each of the α-amylase mRNA levels of lanes 5–12 and 13–20 was first normalized to the rRNA level for each time point. The relative α-amylase mRNA levels then were determined by dividing the mRNA levels by levels of lane 5 or lane 13. The logarithm values of Luc-αAmy3 (Left) and αAmy3 (Right) mRNA levels were subjected to linear regression analysis and plotted as a function of time. The open and solid circles indicate mRNA from cells grown in −S and +S medium, respectively. Error bar indicates the SE of mRNA levels from three independently transformed cell lines. The error bars for mRNA levels from cells grown in −S medium are too short to be shown on the graph. The dashed line indicates the time at which 50% of mRNA remained. The half-life of mRNA is shown at the bottom of the graph.

