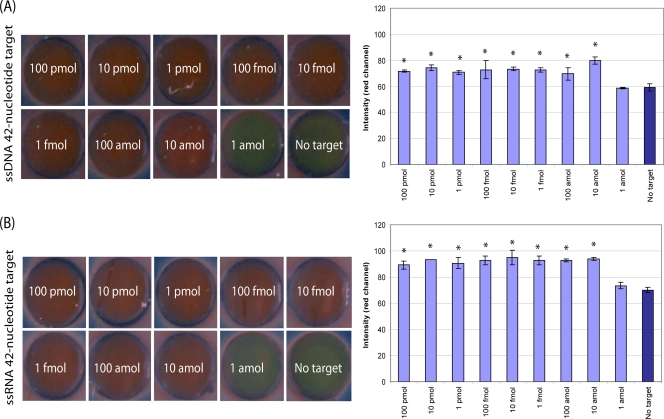
FIG. 2.
Total internal reflection images of synthetic DNA (A) and RNA (B) targets at various dilutions subjected to the aggregation assay and corresponding bar graphs of the measurable signal intensity in the red channel determined by the use of ImageJ software. Each spot is approximately 1.5 mm in diameter and has been resized to fill the full field of view. Image contrast and saturation were adjusted equally for all image panels for visualization and printing purposes only. *, a statistically significant difference in the mean signal intensity compared to that for the negative control with no target DNA or RNA, as determined by a one-way ANOVA (P < 0.05).

