FIG. 3.
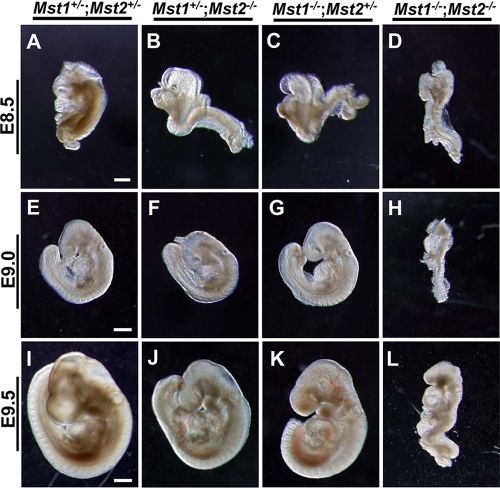
Photomicrographs of Mst1+/−; Mst2+/− embryos (A, E, and I), Mst1+/−; Mst2−/− embryos (B, F, and J), Mst1−/−; Mst2+/− embryos (C, G, and K), and Mst1−/−; Mst2−/− (D, H, and L) embryos. Panels A to D were all taken at one magnification, and panels E to L were taken at a different, higher magnification. Bars, 200 μm (A) and 400 μm (E and I).

