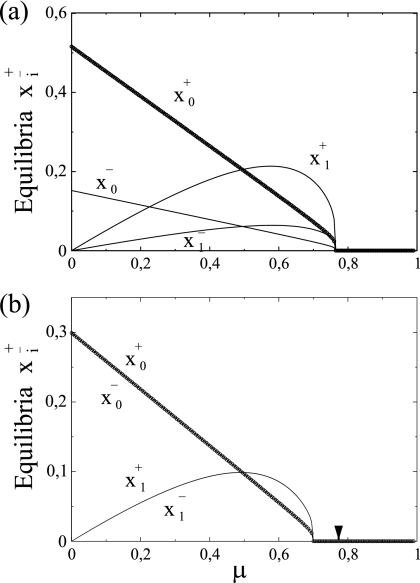
FIG. 3.
Equilibrium concentrations for master (x0±) and mutant (x1±) strands versus mutation rate for SMR (a) and GR (b) modes. All other parameters are as in Table 1. To facilitate the comparison, the arrow indicates the critical mutation rate obtained for the SMR model.

