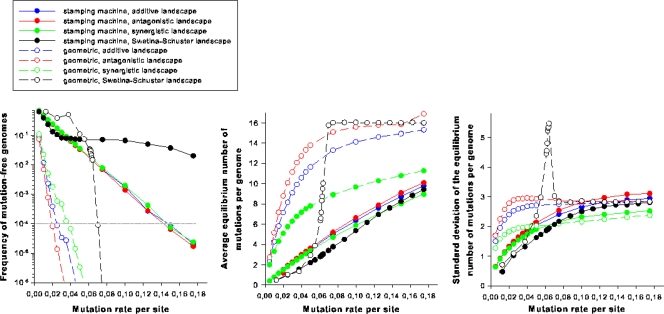
FIG. 6.
Interplay between mutation rate, mode of replication, and the topology of the fitness landscape. (a) Frequency of the mutation-free genomic strands. The dotted horizontal line represents the extinction threshold. (b) Average number of mutations per genome as a function of mutation rate. (c) Standard deviation of the number of mutations per genome.

