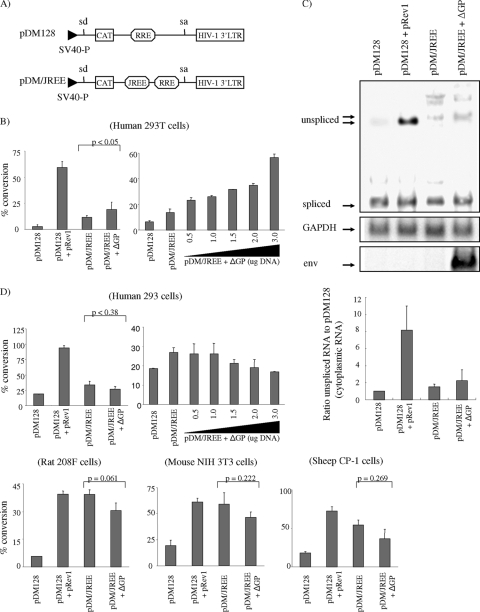
FIG. 8.
Nucleotides in the 3′ region of env (the JREE) are Rej responsive to cytoplasmic export of intron-containing RNA only in human 293T cells. (A) Schematic diagram of pDM128 and pDM/JREE reporter plasmids. The locations of splice donor and acceptor sites (sd and sa, respectively) are shown, as well as coding sequences for CAT, the HIV-1 RRE (RRE), and the JREE. The plasmids are driven by a simian virus 40 early promoter (SV40-P) and utilize the cleavage/poly(A) site of the HIV-1 LTR. (B) pDM128 and pDM/JREE were transfected into human 293T cells, and 48 h posttransfection, CAT activities were measured as described in Materials and Methods. As a positive control, pDM128 was cotransfected with the HIV-1 Rev expression vector, pRev1. To test if the JREE was responsive to Rej, pDM/JREE was cotransfected with the JSRV Rej expression vector, ΔGP, at a ratio of 3 μg to 1 μg DNA, respectively (left panel). This experiment was also performed with variable amounts of ΔGP DNA, ranging from 0.5 μg to 3 μg, while keeping pDM/JREE DNA amounts constant (3 μg) (right panel). To control for transfection efficiency, the pRL-null vector encoding Renilla luciferase was also cotransfected with each of the pDM CAT reporters and the CAT activities were normalized for luciferase activities measured on portions of each transfected cell extract. The results from triplicate experiments are shown (error bars represent standard deviations), and the P value (Student's t test) for the difference between the activities of pDM/JREE and pDM/JREE (cotransfected with Rej; ΔGP) is indicated. (C) Cytoplasmic RNA was isolated from 293T cells 16 h after transfection with the combinations of pDM CAT reporters indicated and subjected to agarose gel electrophoresis and Northern blot hybridization with a 32P-labeled HIV-1 LTR probe followed by phosphorimager analysis. Regions of the blot corresponding to the spliced and unspliced RNA in cytoplasmic RNA are shown (top panel). The blot was stripped and rehybridized with a GAPDH probe (1.2-kb band, arrow, middle panel) and a JSRV env probe (2.4-kb band, arrow, bottom panel) to control for equal loading and expression of rej-containing transcripts, respectively. Phosphorimaging analysis (bar graph) represents the ratio of cytoplasmic unspliced pDM/JREE RNA to pDM128 in the presence or absence of Rej in 293T cells. (D) CAT activity assay in human 293, rat 208F, mouse 3T3, and sheep CP cells using the same constructs and methods as those in the assay in 293T cells (B), described above. Note that a dose-response (for pDM/JREE plus variable amounts of ΔGP DNA) CAT assay was also performed in human 293 cells, identical to what was described above (top right panel).

