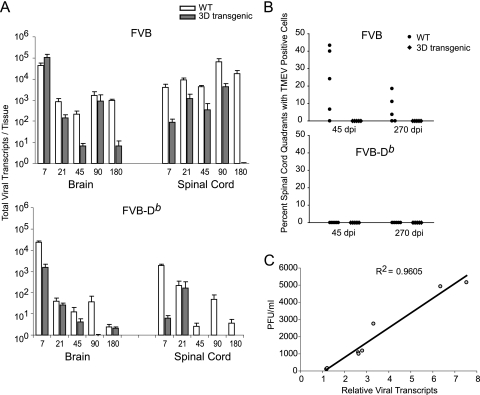
FIG. 2.
Levels of TMEV in the brain and spinal cord of 3D transgenic mice. (A) Viral transcripts were quantified by real-time RT-PCR by using SYBR green. Primers specific for VP2 were used. Viral transcripts calculated from nonspecific amplification in uninfected FVB mice were divided by the viral transcripts of infected mice to set the baseline sensitivity of the assay to 1. White bars show values of infected nontransgenic mice, and dark bars show values of 3D transgenic mice. Data are shown as means ± SEM of five mice per group. WT, wild type. (B) Percentages of spinal cord quadrants containing TMEV-positive cells in the white matter are shown after 45 and 270 dpi by the same immunoperoxidase staining technique as that used for the brain. Each point represents one mouse. (C) Correlation of PFU from plaque assay and relative viral transcripts by real-time RT-PCR after the infection of SQSV cells with TMEV for 8, 16, and 24 h. The same VP2-specific primers were used as those for panel A. Each point represents data obtained from separate replicate samples for both assays.

