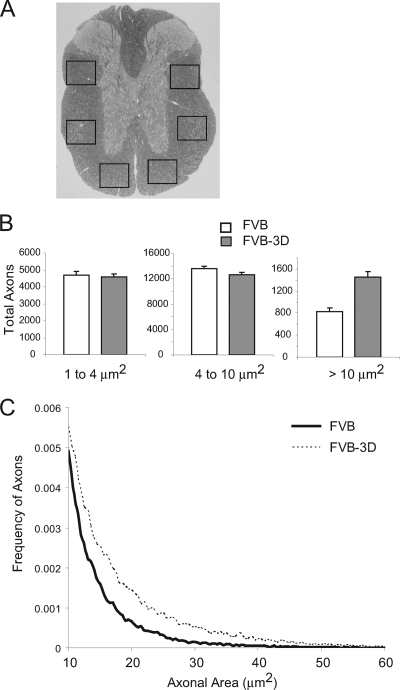
FIG. 7.
Axon counts at 270 dpi in FVB (n = 29) and FVB-3D mice (n = 24). (A) Cross-section of the spinal cord. Boxes show the six areas where axons were counted. (B) Data show the total number of axons per mouse (means ± SEM) as a function of the size of axon diameter (1 to 4 μm, small; 4 to 10 μm, medium; >10 μm, large). (C) Histogram of axons greater than 10 μm in size. The lines represent the relative frequency of large-diameter axons using 0.5-μm2 intervals as bins. Note the tail of large-diameter axons in infected FVB-3D mice but not in infected FVB mice.

