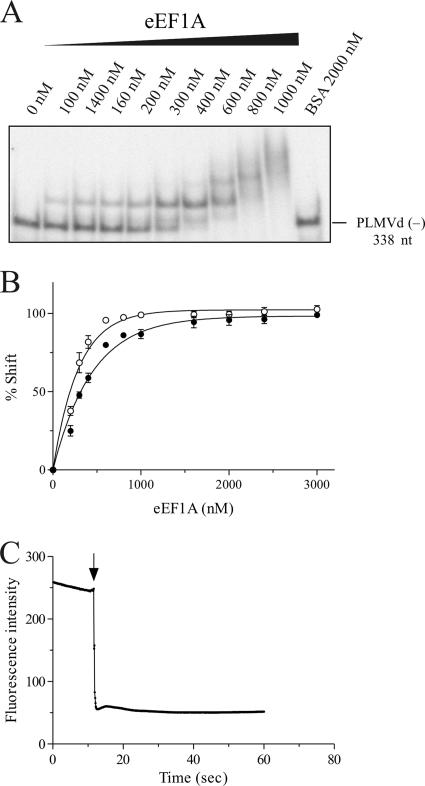
FIG. 5.
EMSAs and fluorescence analysis of PLMVd-eEF1A interaction. (A) Autoradiogram of native polyacrylamide gel obtained using the PLMVd strand of (−) polarity and increasing concentrations of eEF1A. (B) Graphic representation of the percentage of shifted complexes as a function of the eEF1A concentration. Closed circles indicate the PLMVd strand of (+) polarity, while open circles indicate the PLMVd strand of (−) polarity. (C) Fluorescence of eEF1A as a function of time. The arrow indicates the point of injection of the PLMVd (−) RNA. The calculated slope corresponds to the ka of protein binding to the RNA.

