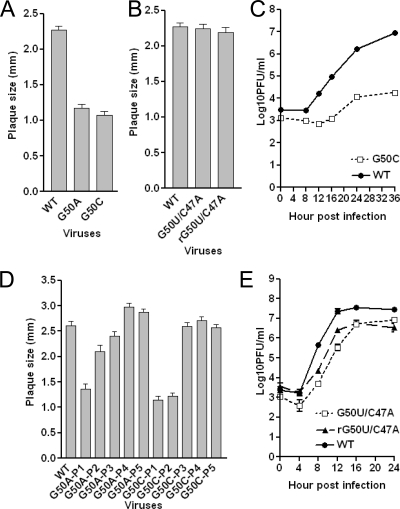
FIG. 6.
Phenotypes of G50 substitution mutant viruses. (A) Average plaque size (± standard errors of the means) of G50A and G50C mutant viruses. (B) Average plaque size (± standard errors of the means) of G50U/C47A and rG50U/C47A mutant viruses. (C) Growth curves were obtained for the G50C substitution mutant at an MOI of 0.01. (D) Average plaque size (± standard errors of the means) of G50A and G50C mutant passages 1 through 5. (E) Growth curves of recovered G50U/C47A and rG50U/C47A mutant viruses at an MOI of 3.

