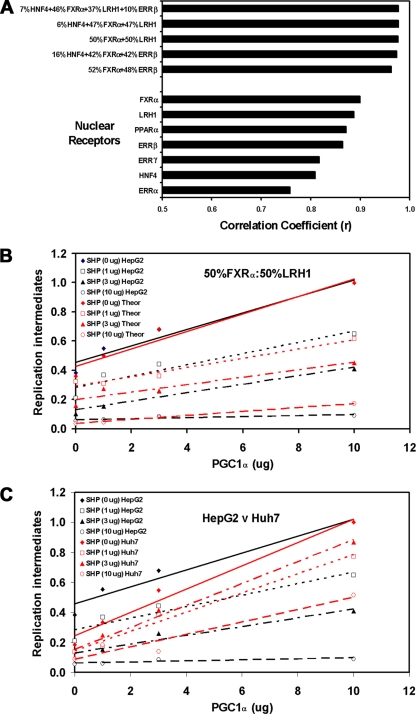
FIG. 4.
Theoretical evaluation of the nuclear receptor combinations governing HBV biosynthesis in HepG2 cells. (A) Correlation coefficient values were determined for optimal combinations of nuclear receptors based on their effects on viral replication in 293T cells compared with that in HepG2 cells in the presence of the different levels of the PGC1α and SHP coregulators. The combinations of nuclear receptors are reported in a descending order, with respect to their correlation coefficient values. Data used to determine the correlation coefficient values for HNF4α, RXRα/PPARα, ERRα, ERRβ, and ERRγ are included in the companion study (18a). 7% HNF4α plus 46% RXRα/FXRα plus 37% LRH1 plus 10% ERRβ, r = 0.977; 8% HNF4α plus 47% RXRα/FXRα plus 47% LRH1, r = 0.977; 50% RXRα/FXRα plus 50% LRH1, r = 0.976; 16% HNF4α plus 42% RXRα/FXRα plus 42% ERRβ, r = 0.974; 52% RXRα/FXRα plus 48% ERRβ, r = 0.963; 100% RXRα/FXRα, r = 0.900; 100% LRH1, r = 0.888; 100% RXRα/PPARα, r = 0.872; 100% ERRβ, r = 0.865; 100% ERRγ, r = 0.817; 100% HNF4α, r = 0.809; 100% ERRα, r = 0.758. (B) Example of the theoretical optimal best fit of the levels of viral replication obtained with RXRα/FXRα plus LRH1 in 293T compared with that in HepG2 cells in the presence of the different levels of the PGC1α and SHP coregulators. Trend lines were calculated using linear regression analysis. (C) Comparison of the levels of viral replication observed in HepG2 cells compared with those observed in Huh7 cells in the presence of the different levels of the PGC1α and SHP coregulators. Trend lines were calculated using linear regression analysis.

