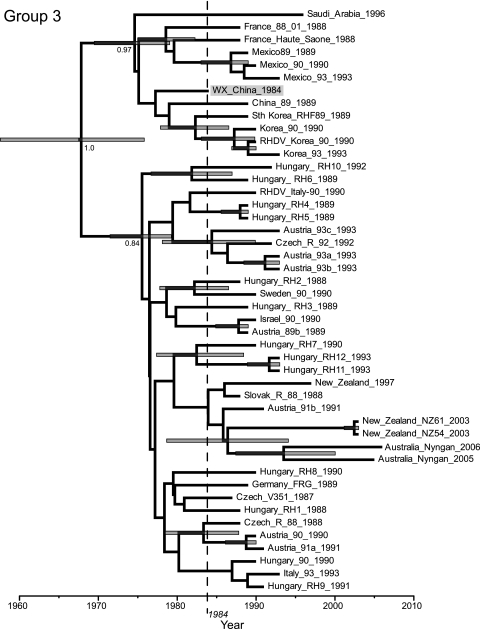
FIG. 3.
MCC tree of RHDV group 3 which contains the earliest Chinese isolate from 1984 (shaded). The time-scale (x axis) is given in years since the most recent sample. Node numbers depict posterior probability values, while node bars the depict the 95% HPD values on node height. The year 1984, indicating the year of the Chinese outbreak, is marked with a dotted line.

