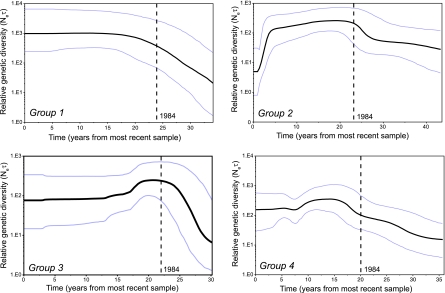
FIG. 4.
Bayesian skyline plots depicting the changing levels of relative genetic diversity through time (Neτ, where Ne is the effective population size and τ the generation time between subsequent transmission events). Note that because the date of the most recent sample differs between groups, the skyline plots for each group are on slightly different absolute time-scales. The year 1984, indicating the year of the Chinese outbreak, is marked with a dotted line.

