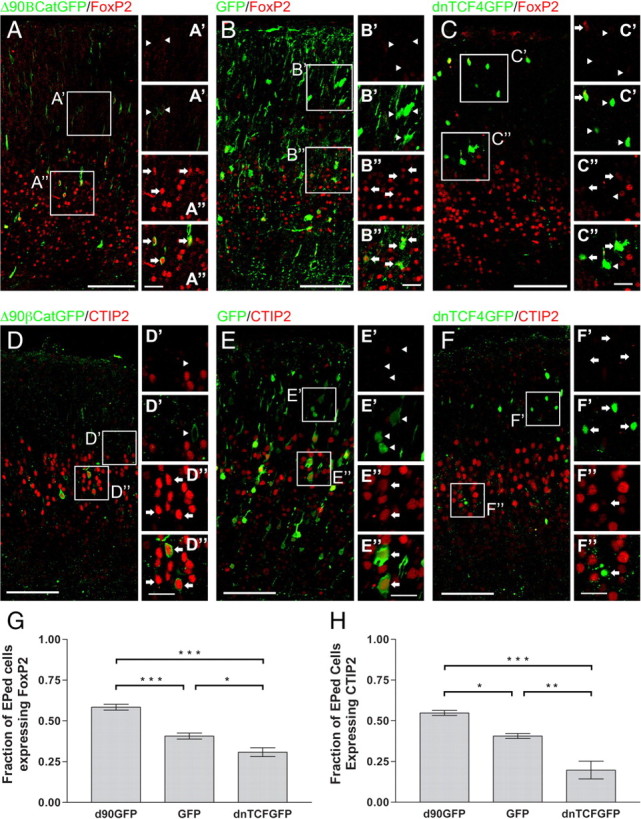
Figure 4.

β-Catenin signaling influences the laminar cell fate of deep-layer cortical projection neurons. D–F, E13.5 embryos were electroporated with Δ90β-catenin-GFP (n = 4 brains), DNTCF4-GFP (n = 3 brains), or GFP (n = 4 brains) constructs. Embryos were killed at E19.5 and sections were stained for GFP and FOXP2 (A–C) or CTIP2 (D–F), markers for cortical layers 5 and 6. G, Fractions of GFP+ cells coexpressing FOXP2 among the three groups were significantly different (p < 0.0001; ANOVA; Newman–Keuls post-test analysis: Δ90β-catenin-GFP vs DNTCF4-GFP, p < 0.001; Δ90β-catenin-GFP vs GFP, p < 0.001, DNTCF4-GFP vs GFP, p < 0.05). H, CTIP2 expression was also significantly different among the three groups (p = 0.0010, ANOVA; Newman–Keuls post-test analysis: Δ90β-catenin-GFP vs DNTCF4-GFP, p < 0.001, Δ90β-catenin-GFP vs GFP, p < 0.05, DNTCF4-GFP vs GFP, p < 0.01). Increasing β-catenin signaling by Δ90β-catenin-GFP increased the fraction of FOXP2+ cells (0.580 ± 0.018, n = 581) and CTIP2+ cells (0.548 ± 0.016, n = 142), while blocking β-catenin signaling decreased the fraction of FOXP2 (0.287 ± 0.027, n = 376)- and CTIP2 (0.197 ± 0.054, n = 297)-positive cells, when compared to control (FOXP2: 0.370 ± 0.018, n = 504; CTIP2: 0.407 ± 0.015, n = 496). Arrows in insets (A′, A″, B′, B″, C′, C″) denote FOXP2+ cells; arrowheads denote FOXP2− cells. Arrows in insets (D′, D″, E′, E″, F′, F″) denote CTIP2+ cells; arrowheads denote CTIP2− cells. The top panel for each inset shows FOXP2 or CTIP2 immunofluorescence, while the bottom panels show merged images. *p < 0.05, **p < 0.01, ***p < 0.001. Scale bars: main panels, 100 μm; insets, 25 μm. Brackets on graphs show SEM.
