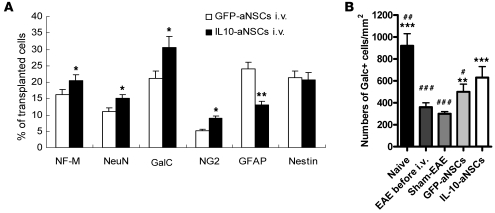
Figure 10. Quantitative analysis of neural cell populations in vivo.
(A) Quantitative analysis of transplanted cells (in Figure 9) showed an increase in the percentages of IL-10–aNSC–derived NG2+ oligodendrocyte precursors, GalC+ oligodendrocytes and NeuN+, and NF-M+ neurons but a decrease in the percentage of GFAP+ astrocytes. Symbols represent mean ± SD; n = 6–8 mice per group. *P < 0.05, **P < 0.01. (B) Quantification of total Galc+ cell numbers. Symbols represent mean ± SD; n = 6–8 mice per group. **P < 0.01, ***P < 0.001, comparisons between sham-EAE and other groups; #P < 0.05, ##P < 0.01, and ###P < 0.001, comparisons between IL-10–aNSCs i.v. and other groups.

