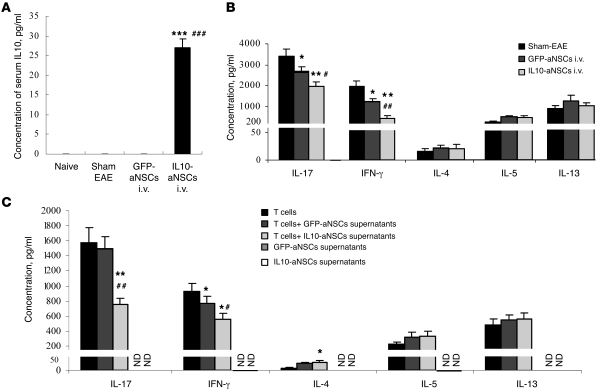
Figure 5. Enhanced immunoregulatory effect of IL-10–aNSCs in the periphery.
(A) Serum IL-10 levels in mice 2 weeks p.t. were assayed by ELISA. Symbols represent mean ± SD; n = 6–8 mice per group. ***P < 0.001 and ###P < 0.001, comparisons between IL-10–aNSCs i.v. and sham-EAE or GFP-aNSCs i.v., respectively. (B) Splenocytes of mice described in Figure 2A (i.v. at day 22 p.i.) were harvested 2 weeks p.t. and stimulated with 10 μg/ml MOG35–55 for 3 days. Concentrations of IL-17, IFN-γ, IL-4, IL-5, and IL-13 in culture supernatants were analyzed by ELISA. Symbols represent mean ± SD; n = 6–8 mice per group. *P < 0.05, **P < 0.01, comparisons among sham-EAE group and other groups; #P < 0.05, ##P < 0.01, comparison between GFP-aNSCs i.v. and IL-10–aNSCs i.v. (C) Splenic CD4+ T cells of naive MOG TCR transgenic mice, of which all CD4+ T cells are specific to MOG35–55, were cultured in conditioned supernatants of GFP-aNSCs or IL-10–aNSCs at a dilution of 1:4 (NSC supernatants/culture medium), which was optimal in our preliminary study (data not shown). Three days after stimulation with 10 μg/ml MOG35–55, supernatants were harvested to measure IL-17, IFN-γ, IL-4, IL-5, and IL-13 by ELISA. Symbols represent mean ± SEM of 4 independent experiments. *P < 0.05, **P < 0.01, comparisons between splenocytes alone and others; #P < 0.05, ##P < 0.01, comparisons between splenocytes plus supernatants of GFP-aNSCs and splenocytes plus supernatants of IL-10–aNSCs. ND, not detectable.

