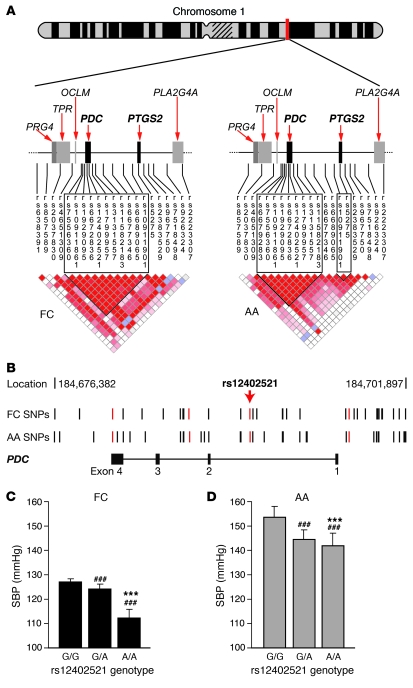
Figure 8. Genetic mapping of blood pressure loci on human chromosome 1.
(A) LD structure for the PDC, PTGS2 region on chromosome 1 of FC (left) and AA (right) populations. D′ values for LD between each marker (red = D′ > 0.8) are presented. In the FC group, PDC and PTGS2 cosegregated in 1 large block of LD, which was separated into 2 LD blocks in the AA population. PRG4, proteoglycan 4; TPR, translocated promoter region; OCLM, oculomedin; PLA2G4A, phospholipase A2 group IV A. (B) SNPs in 2 human populations are shown in their genomic location in relation to the PDC gene. SNPs highlighted in red were genotyped in the full FC and AA populations. (C and D) Average wake SBP in FC and AA populations according to SNP rs12402521 genotype. Generalized estimating equations were used to adjust for familial correlation, age, and gender (***P < 0.0001 vs. G/A genotype; ###P < 0.0001 vs. G/G genotype).

