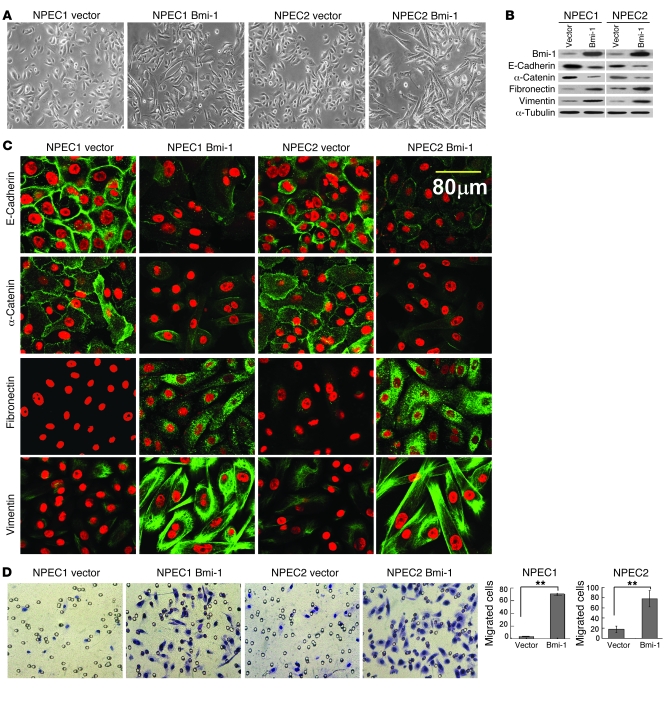
Figure 1. Overexpression of the Bmi-1 gene induces EMT in NPEC cells.
(A) Morphology of NPEC1 and NPEC2 expressing either the control vector pMSCV or pMSCV/Bmi-1 are shown by phase contrast. Original magnification, ×400. (B) Expression of the epithelial proteins E-cadherin and α-catenin and the mesenchymal proteins fibronectin and vimentin in NPEC1 and NPEC2 cells expressing control vector pMSCV or pMSCV/Bmi-1 were detected by Western blot. α-Tubulin was used as a loading control. (C) NPEC1 and NPEC2 cells expressing control vector pMSCV or pMSCV/Bmi-1 were replated on 10% fetal bovine serum/RPMI-1640–precoated coverslips. After an additional 24 hours, cells were stained for E-cadherin, α-catenin, fibronectin, vimentin, and DAPI and analyzed by confocal microscopy. The green signal represents staining for the corresponding protein, while the red signal signifies nuclear DNA staining with rhodamine. Scale bar: 80 μm. (D) The invasive properties of the cells were analyzed in by an invasion assay using a Matrigel-coated Boyden chamber. Migrated cells were plotted as the average number of cells per field of view from 3 different experiments, as described in Methods. Original magnification, ×400. Error bars represent SEM. **P < 0.01.

