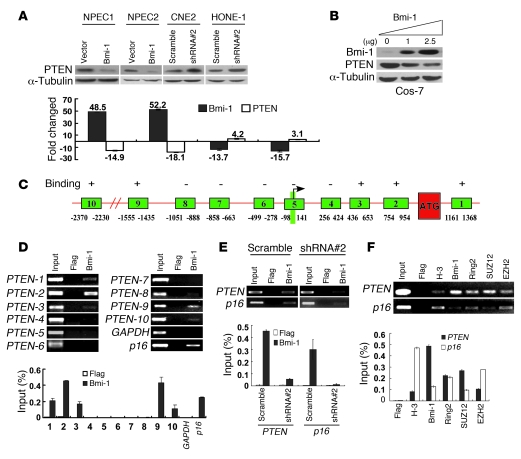
Figure 4. Bmi-1 represses PTEN by binding to the PTEN promoter locus.
(A) Top: Immunoblots showing expression of PTEN in the indicated cells. Bottom: Fold change of PTEN mRNA was analyzed by real-time RT-PCR. A representative result from 3 different experiments is shown. Error bars indicate SEM (n = 3). (B) Cos-7 cells were transiently transfected with different amounts of pcDNA3/Bmi-1 and analyzed by Western blot. (C) Schematic representation of the PTEN promoter regions with or without binding affinity for Bmi-1. Precipitated DNA was amplified by PCR using primers specific for regions 1–10. The arrow indicates the transcriptional start site. ATG, translation start codon. (D) ChIP was performed by using anti–Bmi-1 antibody or anti-Flag antibody to identify Bmi-1 binding sites on the PTEN promoter in CNE2 cells. The p16 promoter was used as a positive control, and GAPDH was used as a negative control. (E) ChIP analysis of Bmi-1 binding efficiency in CNE2 cells expressing the scrambled control shRNA or Bmi-1 shRNA #2. (F) Specific binding for H3K27 (H-3), Ring2, SUZ12, and EZH2 on PTEN and p16 loci was analyzed. Enriched chromatin was analyzed by the Bio-Profile computer-assisted imaging system. In D–F, bar graphs show the means ± SEM performed in triplicate.

