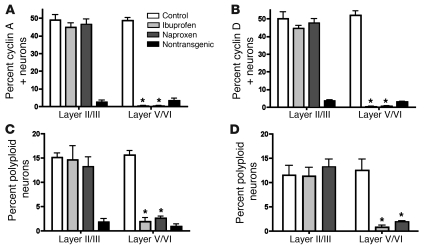
Figure 8. Quantification of inhibition of neuronal CCEs in NSAID therapeutic trial.
Percentages of NeuN-positive neurons in cortical layers II/III and layers V/VI exhibiting expression of cyclin A (A) or cyclin (B) as well as 3 or 4 spots of hybridization with FISH for DNA probes from mouse chromosome 16 (C) and 13 (D) were calculated in R1.40 transgenic mice fed control, ibuprofen-containing, and naproxen-containing diets as well as in nontransgenic mice fed the control diet (n = 5). *P < 0.001 versus control diet–fed R1.40 transgenic mice.

