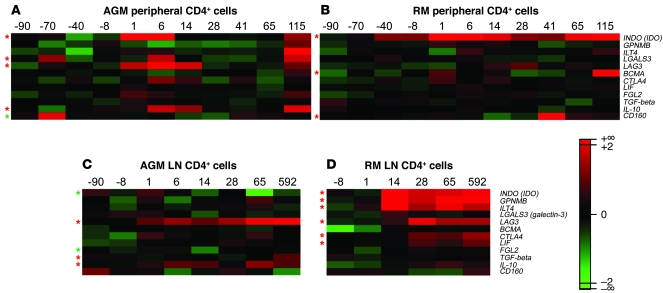
Figure 7. Microarray results for immunosuppressive genes in blood and LN CD4+ cells of SIVagm-infected AGMs and SIVmac-infected RMs.
Heatmaps of expression profiles of immunosuppressive genes are shown for AGM and RM peripheral CD4+ cells (A and B, respectively) and LN CD4+ cells (C and D, respectively). The color scheme indicates the log2Q. Gene expressions shown in red were upregulated and those shown in green were downregulated with respect to baseline levels. Red asterisks indicate probes found to be significantly increased, and green asterisks those significantly decreased after infection as compared with before infection (P < 0.05).

