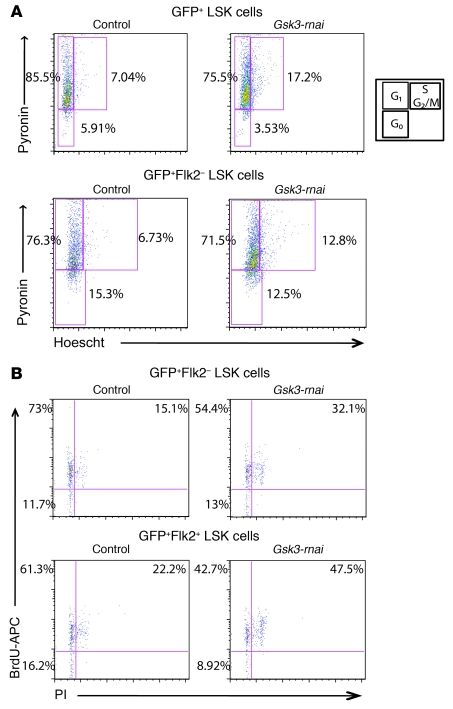
Figure 2. Gsk3 knockdown increases cycling of the HSC-enriched LSK cell population.
(A) To assess cell cycle status of the HSC-enriched LSK population, sorted GFP+ LSK and GFP+ LSK Flk2– cells from primary recipients of control and Gsk3-rnai 4 months after BM transplantation were stained with Hoechst and Pyronin and analyzed by FCM. Representative FACS data are shown for control versus Gsk3-rnai-C2. (B) At 4 months after BM transplantation, primary recipients of control and Gsk3-rnai were fed BrdU in the drinking water for 7 days. Sorted GFP+ LSK Flk2+ and Flk2– cells were stained with BrdU-APC antibody and PI to analyze BrdU incorporation. Representative FACS data are shown for control versus Gsk3-rnai-C2. Similar results were obtained by BrdU versus 7-AAD staining (BD). Percent cells are shown for the indicated gates and quadrants. In A and B, lower left gate represents G0, upper left represents G1, and upper right represents S, G2, and M phases of the cell cycle, as shown in the diagram in A.

