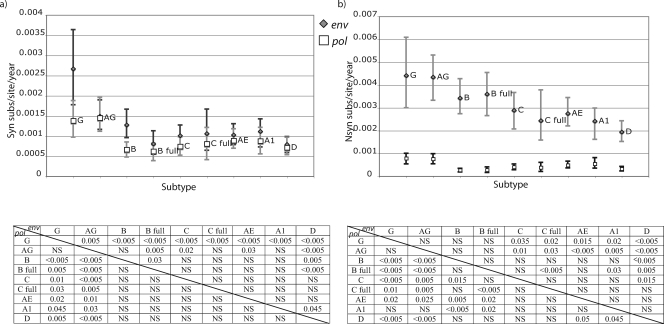
FIG. 2.
Synonymous (a) and nonsynonymous (b) substitutions in pol (white squares) and env (gray diamonds) for the analyzed subtypes and CRFs and 95% CI of the posterior distribution estimated in the Bayesian MCMC analysis. Only internal branches of the tree were included in this analysis. Substitution rate is presented as the number of expected substitutions per site per year (subs/site/year). The P values of significantly different distributions are presented for pairwise comparisons in the table below the plot. P values for the env data set comparisons correspond to the upper right part of the matrix, while pol P values are presented in the lower left part of the matrix. AG, CRF02_AG; AE, CRF01_AE; A1, sub-subtype A1; B, subtype B; B full, subtype B full-genome data set; C, subtype C; C full, subtype C full-genome data set; D, subtype D; G, subtype G; NS, not significant.

