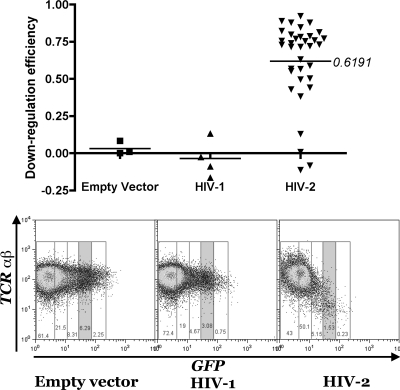
FIG. 2.
TCR downregulation by HIV-2 Nef. Primary CD4 T cells expressing various alleles of nef were compared for TCR surface expression. The TCR downregulation efficiency was calculated as 1 minus the ratio of the geographic mean of TCR-associated fluorescence (PE MFI) in GFP-expressing cells divided by the PE MFI in GFP-negative fractions (upper panel). In the lower panel, representative FACS plots of TCR and GFP expression are shown. The shaded boxes were used to define the Nef-expressing cells.

