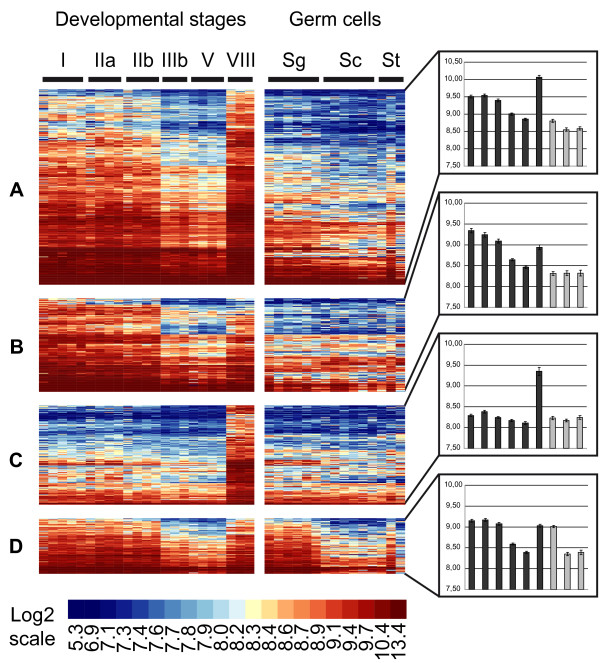
Figure 2.
Somatic expression clusters during rainbow trout spermatogenesis. Heatmap representation of genes preferentially expressed in somatic cells during trout spermatogenesis. After statistical filtrations, co-expressed genes were classified in 9 clusters (A-I, see also figure 3) according to expression profiles in developmental stages and isolated germ cells using the PAM algorithm. Each line represents the expression signal of a single clone and each column is a sample. Roman numerals (I-VIII) indicate testicular developmental stages. Sg = spermatogonia; Sc = spermatocytes; St = spermatids. Log-2 transformed signal intensities are shown according to the scale bar. Median expression profiles for each cluster are also presented (Histograms, right panels).

