Figure 5.
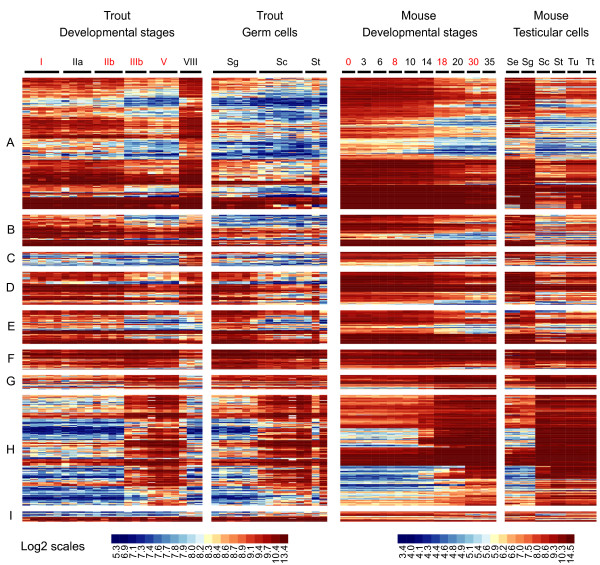
Correlated expression of conserved genes during spermatogenesis in trout and mouse. Expression profiles during spermatogenesis in trout and mouse (datasets GSE12769 and E-TABM-130) were compared. Mouse orthologs of differentially expressed trout genes were first identified using the Ensembl database and filtered to select only those genes with significant expression in at least one mouse developmental stage (Signal intensity ≥ median value). A correlation test was then performed to select genes with similar expression profiles (correlation ≥0.8) in trout and mouse developmental stages. Each line represents the expression signal of a trout clone and a corresponding mouse probeset. Gene expression in trout developmental stages, trout isolated germ cells, mouse developmental stages and trout isolated testicular cells is sorted according to the 9 trout expression clusters (A-I). Roman numerals (I-VIII) indicate trout developmental stages whereas numeric numbers (0-35) indicate mouse post-partum days. Samples used for the correlation test are indicated in red. Se = Sertoli cell; Sg = spermatogonia; Sc = spermatocytes; St = spermatids; Tu = mouse seminiferous tubules; Tt = mouse total testes. Log-2 transformed signal intensities are shown according to respective scale bars.

