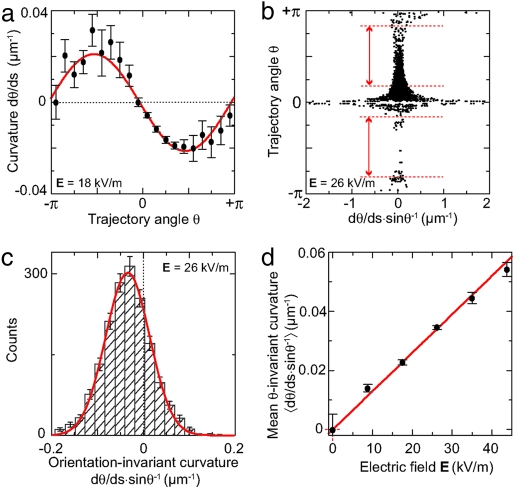
Fig. 3.
Quantification of microtubule-trajectory curvatures. (a) Measured trajectory curvature as a function of tangent trajectory angle. We show binned values [mean ± standard error of the mean (SEM)] of 3,600 measurements. (b) Orientation-invariant curvatures for different θ. The divergence around θ = 0 and ±π arises from division by small values of sin(θ). The intervals denoted between the red lines (|sin(θ)| > 0.5) are included in the histogram. (c) Histogram and Gaussian fit of orientation-invariant trajectory curvatures of the data in b. (d) Mean orientation-invariant curvature, as determined from Gaussian fits to histograms, as a function of electric field. Error bars denote the error in the fit.

