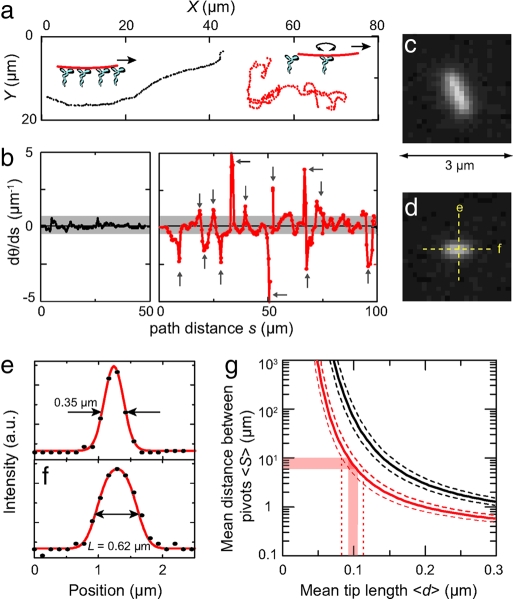
Fig. 4.
Measurement of microtubule tip length. (a) Trajectories of two short microtubules without an applied electric field. One microtubule (shown in c, with length 0.89 ± 0.06 μm) moves without sudden changes of direction (black trace). The shorter microtubule (shown in d with length 0.63 ± 0.05 μm) displays sudden changes in direction (red trace), presumably because at these moments it is bound to only a single kinesin molecule and rotationally free. (b) Curvature as a function of distance along the trajectory for the two trajectories shown in a. (c and d) Fluorescence images of the two microtubules. Intensity line-scans parallel and perpendicular to the shortest microtubule are denoted. (e and f ) Intensity linescans taken along the directions indicated in d. The scan perpendicular to the microtubule (e) is used as an approximation of the point-spread-function, with the full-width-at-half-maximum indicated. In the scans along the microtubule (f ), we indicate the deconvoluted length. (g) Plots of Eq. 4 for microtubules of lengths 0.63 ± 0.05 μm (red lines) and 0.89 ± 0.06 μm (black lines). The dotted lines indicate the margins in 〈S〉 due to the error in L.

